Anonymous networking with Tor

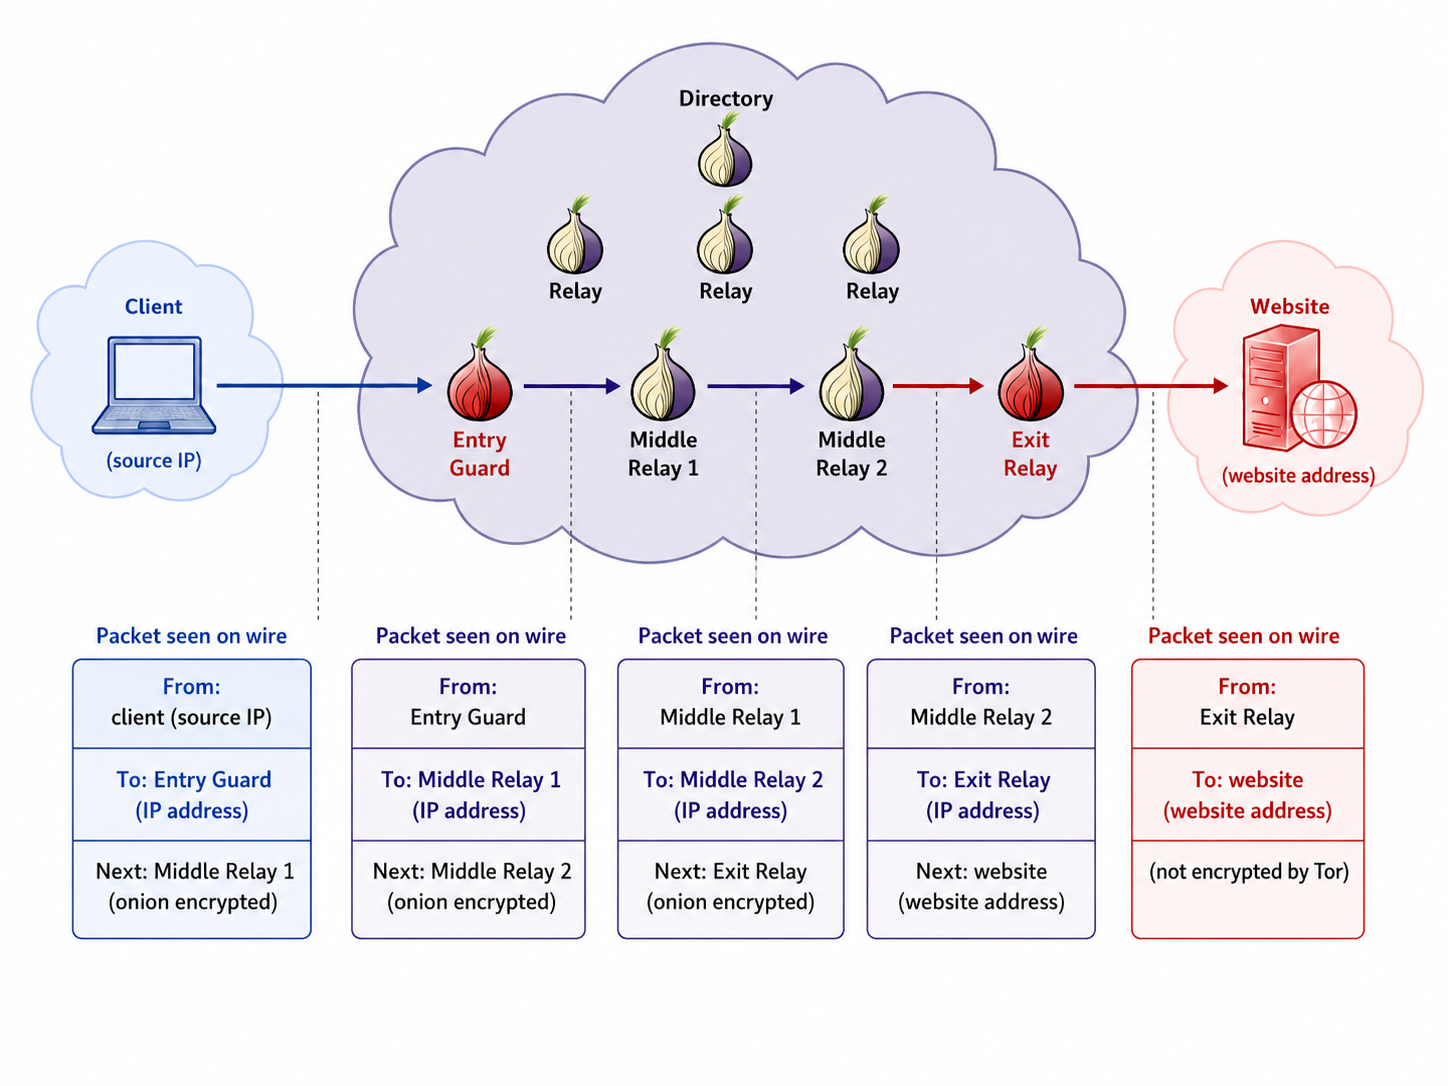
In this experiment, we will set up a private Tor network, and we'll see how Tor supports anonymous web browsing and anonymous web services. This experiment will take approximately 60-90 minutes.
You can run this experiment on Cloudlab. Refer to the testbed-specific prerequisites listed below.
Cloudlab-specific instructions: Prerequisites
To reproduce this experiment on Cloudlab, you will need an account on Cloudlab, you will need to have joined a project, and you will need to have set up SSH access.
Background
Tor is an anonymity network, used by people around the world to browse the Internet anonymously. When using Tor, network traffic is encrypted with multiple layers of encryption and routed through a sequence of Tor relays, which facilitates an anonymous connection between the source user and destination host.
The source address is known to first Tor relay along the path (and to eavesdroppers on networks between the source and the first Tor relay), and the destination address is known to the last Tor relay along the path (and to eavesdroppers on networks between the last Tor relay and the destination). However, none of the Tor relays, destination hosts, or eavesdroppers on a single network can easily identify both source and destination address.
Tor can also be used to host services that accept incoming connections over the Tor network, where the network address of the server remains a secret. This is called a "hidden service" or "onion service".
A hidden service does not publish a reachable IP address. Its .onion address is derived from the service identity key. The service builds circuits to introduction points and publishes a signed descriptor that lists those points. A client retrieves and verifies that descriptor, chooses a rendezvous point, and sends an introduction through one of the service's introduction points. The service then builds its own circuit to the rendezvous point. The rendezvous point joins the two circuits, so the client and the service can exchange encrypted traffic without learning each other's network location.
Run my experiment
First, we need to reserve resources for the experiment.
We will use the following topology, with three directory authority Tor nodes, three non-directory-authority Tor relay nodes, and as Tor client node. The topology also includes a web server, which we will visit directly and over the Tor network.
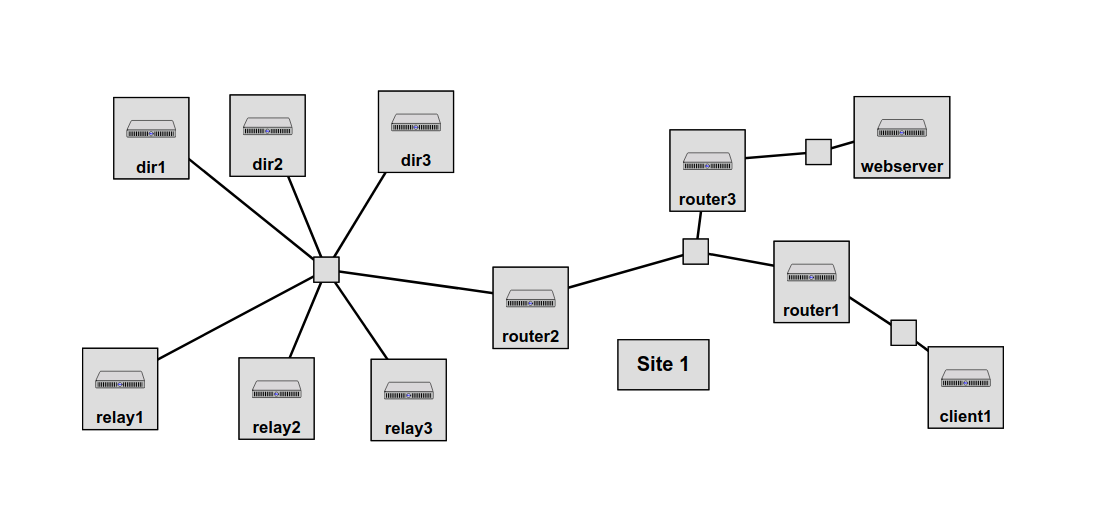
with IP addresses assigned to Tor nodes as follows:
- dir1: 10.10.1.1
- dir2: 10.10.1.2
- dir3: 10.10.1.3
- relay1: 10.10.101.1
- relay2: 10.10.102.2
- relay3: 10.10.103.3
The client node has IP address 10.10.201.1, and the webserver node has IP address 10.10.253.200.
Cloudlab-specific instructions: Reserve resources
To reserve these resources on Cloudlab, open this profile page:
https://www.cloudlab.us/p/CloudLab/tor-cloudlab
and click "Instantiate". You can accept the default parameters, then click "next", then select the Cloudlab project that you are part of and a Cloudlab cluster with available resources. (This experiment is compatible with any of the Cloudlab clusters.) Then click "next", and "finish".
As these nodes boot up, they will follow a sequence of instructions in a setup script that tells them to install Tor, set up cryptographic fingerprints, modify the Tor configuration file to include the fingerprints of all three directory authority nodes, and then restart Tor. This process takes a long time, especially because some nodes may not boot up as quickly as others.
Watch the topology view while the hosts start. Hosts first appear yellow with a small ⊝ icon in the top right corner. They may turn green with a ⊙ icon while startup services are still running. Wait until every host is green with a ✓ icon. The check mark means that the host is fully configured and ready to use. Then, click on "List View" to get SSH login details for the hosts and routers. Use these details to SSH into each.
When you have logged in to each node, continue to the next section.
Verify that Tor network is running
Log in to the client node and verify that it is connected to the Tor network by running
sudo -u debian-tor nyx
Click the right arrow key on your keyboard to see the list of Tor connections and circuits. Look for built GENERAL circuits with three relays. A circuit list may include an entry like this:
  ID   | Age  | Path                    | State | Purpose
 -----+------+-------------------------+-------+---------
  420  | 163s | ~dir1->~relay3->~relay2 | BUILT | GENERAL
To exit nyx, type q and then type q again to confirm that you want to quit.
Note: If you runnyxand get a long error message that_curses.error: curses function returned NULL, it's because your terminal window is too small! Resize the window in which you're runningnyxand try again.
Verify client anonymity
Next, we'll verify that the client is anonymous to the server when using Tor.
We will use tcpdump to view network traffic while also saving packets to a file. On the webserver, run
sudo tcpdump -i eth1 'port 80' -U -w - | tee $(hostname -s)-http-no-tor.pcap | tcpdump -nnxxXSs 1514 -r -
Then, in a second terminal on the web server node, run
sudo tail -f /var/log/apache2/access.log
First, we will see how the client appears to the web server when it connects normally. On the client, run:
curl http://10.10.253.200/
Note the line that appears in the web server's access log, which includes the IP address from which this access appears. It should show the client's IP address. Run ip addr on the client to verify that this address belongs to the client.
Use Ctrl+C to stop the tcpdump process, and then start a new one for the scenario with Tor:
sudo tcpdump -i eth1 'port 80' -U -w - | tee $(hostname -s)-http-with-tor.pcap | tcpdump -nnxxXSs 1514 -r -
Then, access the webserver again from the client, but through the Tor network, and see how the client appears to the webserver this time:
curl --socks5-hostname 127.0.0.1:9050 http://10.10.253.200/
The new line that appears in the web server's access log, should not include any address that belongs to the client - it will instead have the IP address of the exit guard. Run ip addr on each of the relay and directory authority nodes to identify the Tor node that this address belongs to.
Use Ctrl+C to stop the tcpdump process.
Transfer both packet captures to your laptop for further analysis.
- In Wireshark, open the packet capture from the scenario without Tor. Right click on a packet from the TCP exchange, and choose Follow > TCP Stream. Is the HTTP request and response encrypted?
- In Wireshark, open the packet capture from the scenario with Tor. Right click on a packet from the TCP exchange, and choose Follow > TCP Stream. Is the HTTP request and response encrypted once it leaves the Tor network?
Examine a Tor circuit
In the previous section, you identified the exit guard - the Tor relay at which traffic leaves the Tor network en route to its final destination. Between the client and the exit guard, this traffic traverses multiple hops, in order to preserve the client's anonymity.
To see how this works, we'll set up a longer-running stream using iperf over Tor. On the webserver node and the client node, run
sudo apt -y install iperf3
We are going to use the carml Python module to monitor Tor circuits. On the client node, run
sudo apt -y install python3-pip python3-dev libffi-dev build-essential
sudo -H -u debian-tor python3 -m pip install --break-system-packages carml==21.1.0
sudo -H -u debian-tor python3 -m pip install --break-system-packages setuptools==68.2.2
Then, on the client node, run
sudo -H -u debian-tor python3 -m carml monitor
and leave it running. When you first run the carml monitor, it will show you a list of circuits (paths through the Tor network) and a numeric ID associated with each one, e.g.
  ID   | Age   | Path (router names, ~ means no Named flag) | State    | Purpose
 ------+-------+--------------------------------------------+----------+------------
   776 |  134s | ~dir3->~relay2->~dir1                      | BUILT    | CONFLUX_LINKED
 ------+-------+--------------------------------------------+----------+------------
If you initiate a stream through the Tor network, it will tell you which circuit (by numeric ID) the stream is "attached" to, e.g. which circuit this stream flows through. It will also alert you as new circuits are built (with new numeric IDs) and as old circuits are removed.
With carml running, we are ready to start an iperf stream between client and webserver. On the webserver, run
iperf3 -s
and on another terminal on the client, run
proxychains iperf3 -c 10.10.253.200 -t 360
to send traffic to the server using iperf over Tor. We've set it to run for 360 seconds, but you can change that value if you need more time.
In the carml output, check which circuit your stream(s) is attached to, and then identify the path associated with that circuit. e.g.
Current streams:
  Stream 45 to 10.10.253.200:5201 attached via circuit 776
  Stream 44 to 10.10.253.200:5201 attached via circuit 776
Current circuits:
  ID   | Age   | Path (router names, ~ means no Named flag) | State    | Purpose
 ------+-------+--------------------------------------------+----------+------------
   776 |  134s | ~dir3->~relay2->~dir1                      | BUILT    | CONFLUX_LINKED
 ------+-------+--------------------------------------------+----------+------------
Identify:
- the entry guard
- the middle guard
- and the exit guard
Now, we will inspect the packet headers of this flow as it traverses each step in this path.
In another terminal window on the client, run
sudo tcpdump -i eth1 -n src $(hostname -I | tr " " "\n" | grep "10.10") and greater 1400
(limiting our capture to large packets from the client node.) Identify the IP address of the Tor relay to which the bulk of this traffic is flowing. That node is the entry guard.
Next, open a terminal on the node that you idenfitied as entry guard, and repeat the tcpdump:
sudo tcpdump -i eth1 -n src $(hostname -I | tr " " "\n" | grep "10.10") and greater 1400
Identify the IP address of the Tor relay to which the bulk of traffic from the entry guard is flowing. That node is the middle guard.
Open a terminal on the node that you identified as the middle guard, and repeat the tcpdump:
sudo tcpdump -i eth1 -n src $(hostname -I | tr " " "\n" | grep "10.10") and greater 1400
Identify the IP address of the Tor relay to which the bulk of traffic from the middle guard is flowing. That node is the exit guard.
Finally, open a terminal on the node that you identified as the exit guard, and repeat the tcpdump:
sudo tcpdump -i eth1 -n src $(hostname -I | tr " " "\n" | grep "10.10") and greater 1400
You should see traffic flowing from the exit guard to the destination (the webserver).
- Review the
tcpdumpoutput you captured - does the path you identified match the circuit that carml told you youriperf3stream is attached to? - What is the source and destination IP address at each step in the path? Is there any guard that is aware of both the "true" source IP (the client's IP) and the "true" destination IP (the webserver's IP)?
Run a Tor hidden service
Tor can also be used to provide anonymity to the web service, not only to the client. To see how this works, we'll set up a "hidden service" - a web service protected by Tor - on the webserver.
On the webserver node, run
cd /local/repository
sudo bash client-fast-install.sh
to install Tor. Also install carml:
sudo apt -y install python3-pip python3-dev libffi-dev build-essential
sudo -H -u debian-tor python3 -m pip install --break-system-packages carml==21.1.0
sudo -H -u debian-tor python3 -m pip install --break-system-packages setuptools==68.2.2
Then, run
sudo -u debian-tor mkdir /var/lib/tor/hidden_service
to create a hidden service configuration directory.
Edit the Tor config file on the webserver with
sudo nano /etc/tor/torrc
and add the following lines at the bottom:
HiddenServiceDir /var/lib/tor/hidden_service/http
HiddenServicePort 80 127.0.0.1:80
Use Ctrl+O to save the file (and Enter to confirm the filename) and then Ctrl+X to quit nano. Finally, restart the Tor service on the webserver node with
sudo systemctl restart tor@default
If you run the carml monitor again on the webserver, you'll see some circuits that with a different purpose that you have not seen before - these new circuits are HS_SERVICE_HSDIR and HS_SERVICE_INTRO circuits. We'll explain these in more detail shortly.
sudo -H -u debian-tor python3 -m carml monitor --once
Also, if you run
sudo -u debian-tor cat /var/lib/tor/hidden_service/http/hostname
you'll get the name of your hidden service. This name is a 16-character hash derived from the service's public key, can be used to access the service from any Tor client, without the client ever learning the service's true IP address. Here is how it works:
- The hidden service selects some Tor nodes as introduction points, and builds circuits to these introduction points. As long as these circuits are "alive", the introduction points are able to reach the hidden service.
- Then, the hidden service publishes a signed hidden service descriptor, which includes the service's public key and a list of introduction points. This descriptor is distributed throughout the Tor network.
- When a client wants to connect to the hidden service, it gets the hidden service descriptor from the Tor network, and learns the service's introduction points and public key.
- The client selects a Tor node to act as a rendezvous point, builds a circuit to the rendezvous point, and sends it a one-time secret.
- The client creates an Introduce message, which includes the address of the rendezvous point and the one-time secret. The client encrypts this message with the hidden service's public key, builds a Tor circuit to one of the introduction points, and sends the encrypted message to the introduction point over the Tor circuit, with instructions for it to be forwarded to the hidden service.
- The hidden service receives the encrypted Introduce message over the circuit that it had previously established with the introduction point. It decrypts the message and learns the one-time secret and the address of the rendezvous point.
- The hidden service creates a Rendezvous message containing the one-time secret. It builds a circuit to the rendezvous point and sends the message over this circuit.
- Now that both the client and the hidden service have connected to the rendezvous point (via separate circuits), they can to send traffic back and forth via the rendezvous point and their respective circuits to it.
Try this now - on both the client node and the webserver node, run
sudo -H -u debian-tor python3 -m carml monitor
to monitor circuits.
On the webserver node, you will notice some circuits for updating the hidden services directory information (HS_SERVICE_HSDIR). You should also be able to find some circuits that have been built between the hidden service and its introduction points (HS_SERVICE_INTRO).
While the carml monitor is running on both the client and the webserver, on the client node, run
curl --socks5-hostname 127.0.0.1:9050 vfembklbr2dcm6ijofveng3iurpuzrguwhhhkqmgrvwjzmy7ji756zid.onion
(substituting the name of your own hidden service, which you found earlier, in place of the last argument.)
In the carml output on the client, note that:
- The client will initially use a
HS_CLIENT_HSDIRcircuit to get the hidden service descriptor from the network. - It will build a
HS_CLIENT_RENDcircuit to a rendezvous point. - Then, it will use a
HS_CLIENT_INTROcircuit to send an Introduce message to the hidden service via an introduction point. - When this message is forwarded to the service, it will build a
HS_SERVICE_RENDcircuit to the rendezvous point. - The client and service can then exchange messages and data using their respective rendezvous point circuits.
Note: If there are too many HS_SERVICE_HSDIR circuits on the server to easily find the others, you can exclude these from the output. To see a list of circuits excluding the HS_SERVICE_HSDIR circuits, use
sudo -H -u debian-tor python3 -m carml monitor --once | grep -v "HS_SERVICE_HSDIR"
Notes
This experiment is a modified version of the experiment by Takuya Fukui and on the experiment by Bintia Keita.
In July 2026, this experiment was updated from Ubuntu 18.04 to Ubuntu 24.04.